Peak expiratory flow in normal adult subjects
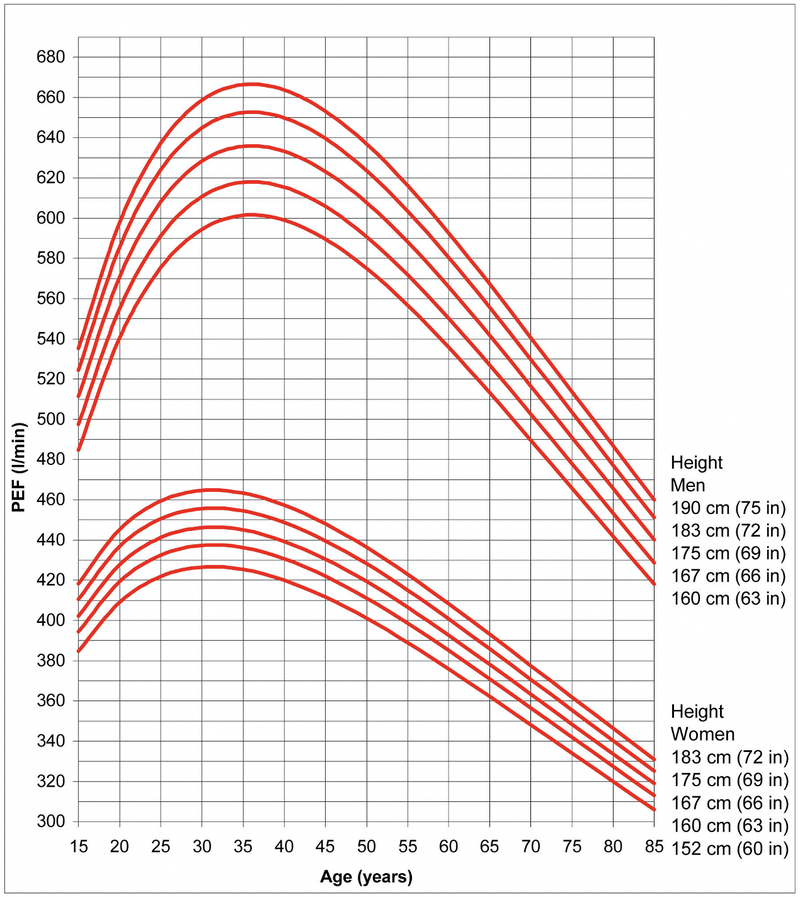
Adapted with permission from
Nunn AJ Gregg I, Br Med J 1989:298;1068-70
and Clement Clarke International
CALCULATING % PREDICTED PEAK FLOW RATE
- Take the best of 3 of the patient’s observed peak flow rate:
- e.g. 200, 180, 190 performed – so take 200.
- Find the patient’s sex, age and height predicted value from the nomogram.
- e.g. 440 for a woman of age 25 years and height 167 cm
- Divide patient’s observed peak flow rate over their predicted peak flow rate:
- e.g. 200/440 = 0.45
- Multiply by 100:
- e.g. 0.45X100 = 45%
So, in this example, the patient’s observed peak flow rate is 45% of predicted.
CALCULATING PEAK FLOW VARIABILITY
There are a number of methods for calculating PEF variability.
One method is described below:
- Subtract the lowest from the highest reading.
- Divide by the highest reading.
- Multiply by 100.
So, in this example, where a patient has readings of 300 to 400, the variability is 25%. If these readings were taken before and after a test dose of salbutamol, asthma is diagnosed. (See sections 16.1 Asthma, acute and 16.2 Asthma, chronic persistent).
ASTHMA CONTROL TEST™
This is a validated measure of clinical asthma control that can be completed by the patient (after initial instruction) at each visit to the clinic prior to consultation. A value of ≥19 suggests adequate asthma control.
Online version of the test is accessible at: https://www.asthmacontroltest.com/
REFERENCES
Reference: Nathan RA, Sorkness CA, Kosinski M, Schatz M, Li JT, Marcus P, Murray JJ, Pendergraft TB. Development of the asthma control test: a survey for assessing asthma control. J Allergy Clin Immunol. 2004 Jan;113(1):59-65. http://www.ncbi.nlm.nih.gov/pubmed/14713908